 Docs
Docs
The console
One workspace for the graph and for the identities you run. Explore infrastructure, run investigations, and give every agent or device a verifiable address, all from one console.
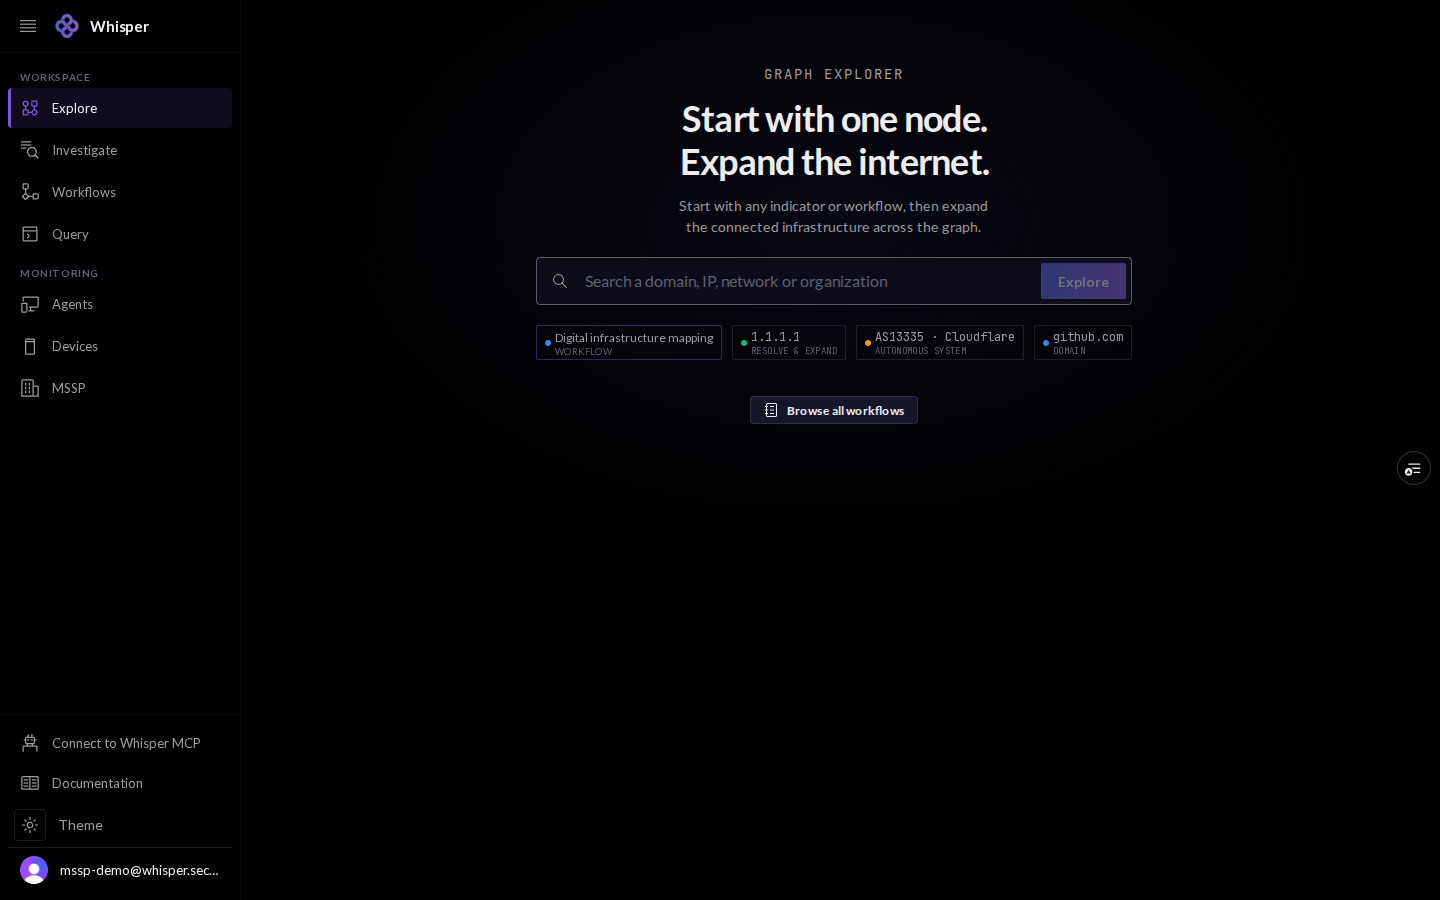
The console is the visual front door to Whisper. The left rail splits in two: a Workspace for reading the graph (Explore, Investigate, Workflows, Query) and a Monitoring area for the identities you run (Agents and Devices).
Everything the console shows, anyone can verify from the open internet with dig, curl, and RDAP. It is a convenience over public records, not a source of truth. Every screenshot here is a demo workspace with illustrative data.
1 · The workspace
The Workspace tools read the Whisper security graph. Explore walks connected infrastructure visually, Investigate runs a guided workflow on one indicator, Workflows is the full library of those runs, and Query is a read-only Cypher console.
2 · Monitoring your identities
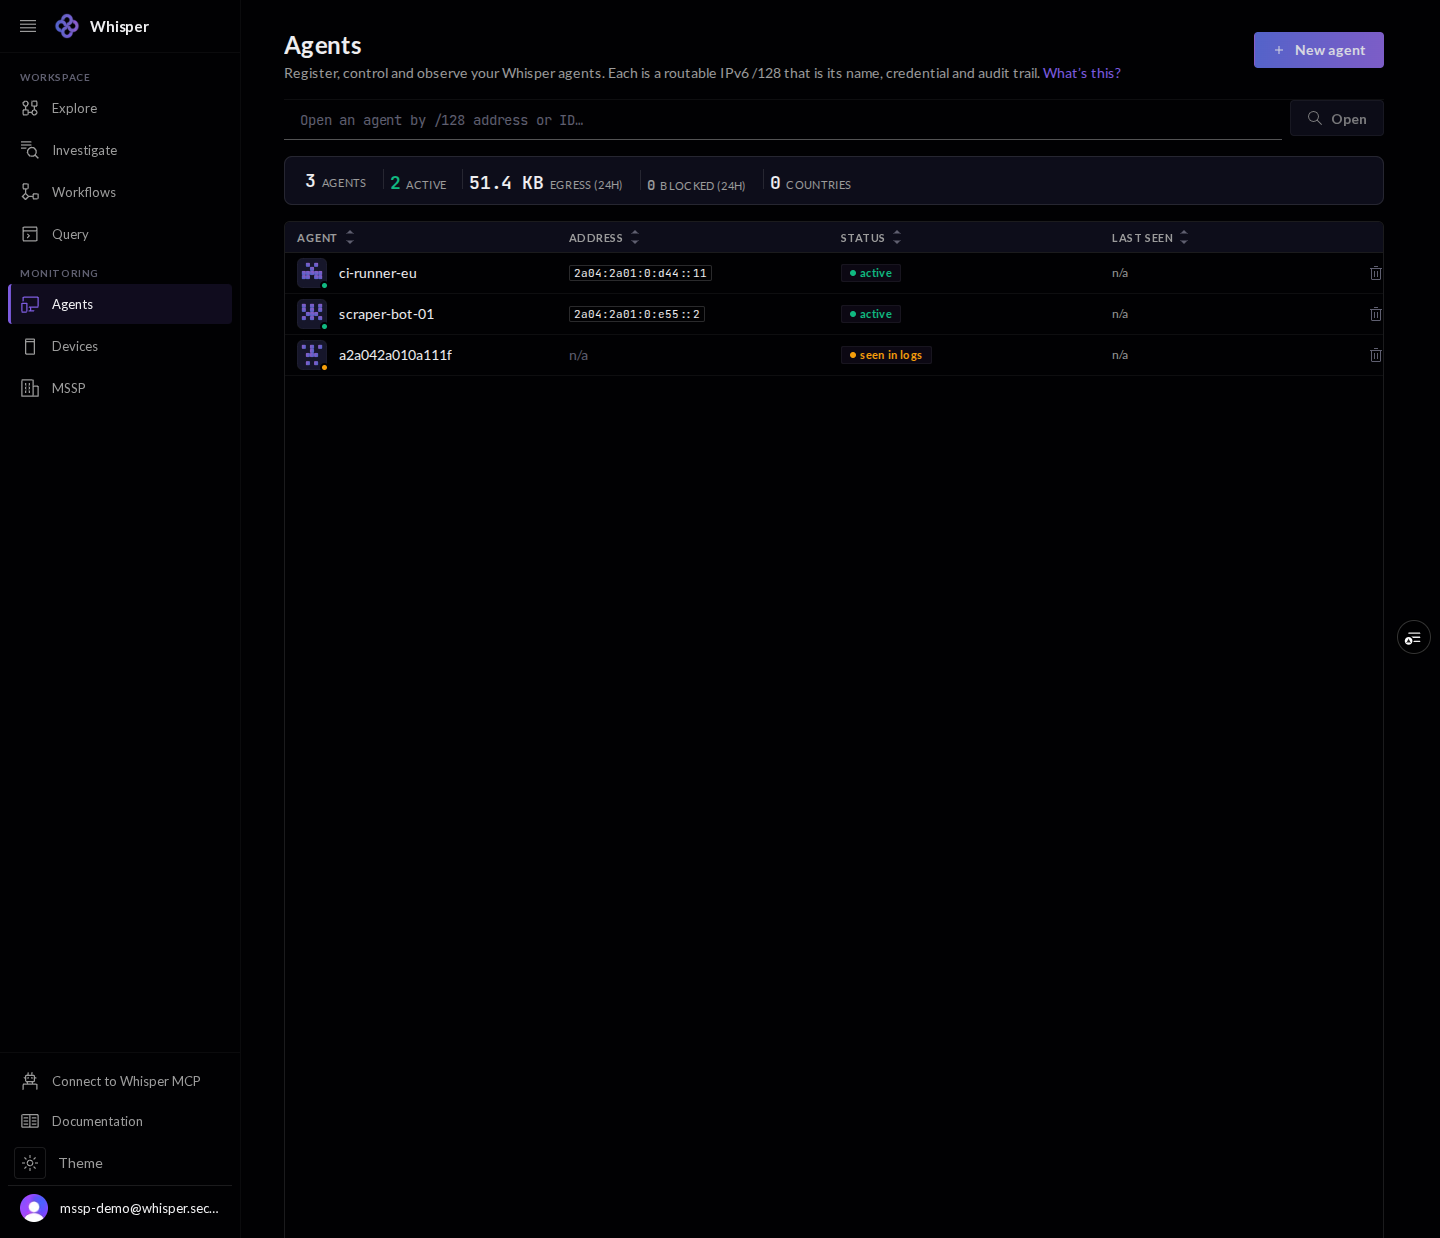
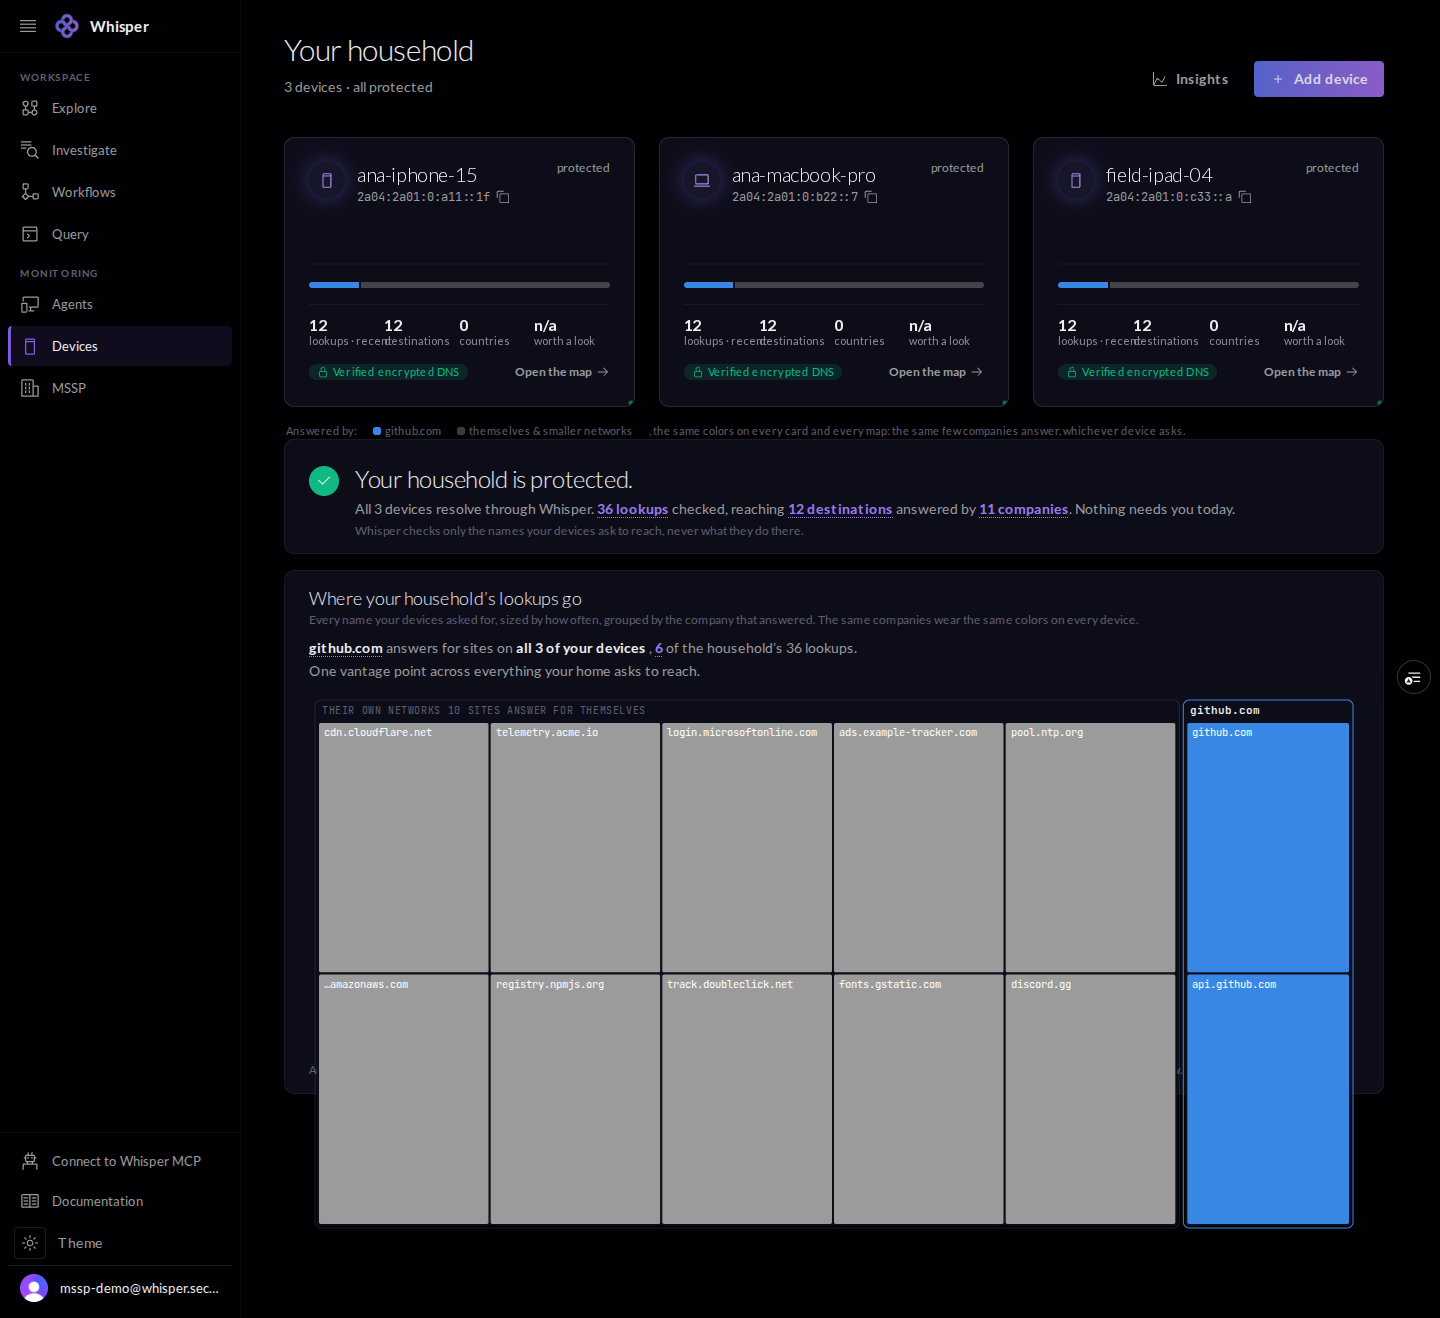
The Monitoring area is where you provision and watch what you run. Agents are your headless workloads; Devices are the laptops and phones in a household or fleet. Each is a routable IPv6 /128 that is at once its name, its credential, and its audit trail.
3 · Access and keys
Sign in with your account, or connect a client without the browser at all. Connect over MCP wires an IDE or AI client to the graph; Account and keys covers your profile, API keys, plan, and support. A key is optional for read-only checks and unlocks the full control plane when you supply it.